

FPI Update #8: The Last Three Driver Domains
How physical activity, sleep, and substance use round out the behavioral layer

As preprocessing wraps up, I wanted to finish with the three driver domains people understand most intuitively: physical activity, sleep, and substance use. Together with nutrition, these form the behavioral foundation the FPI draws recommendations from. When the model surfaces guidance for someone, it will be grounded in what they eat, how they move, how they sleep, and what they consume.
The intuition of this layer is part of what makes it so interesting to build. People already have strong priors about exercise, sleep, and substance use. The model's job is not to confirm what everyone already suspects, but to find where the signal actually exists and how strong it is compared to everything else in the system.
Physical Activity
NHANES grouped physical activity into two primary types:
Moderate activity: causes light sweating or a moderate increase in breathing and heart rate. Brisk walking, casual cycling, recreational swimming, and light yoga.
Vigorous activity: causes heavy sweating or a large increase in breathing and heart rate. Running, HIIT, competitive sports, and heavy resistance training.
Sedentary time was also collected independently, capturing how much of the day someone spends sitting regardless of how much they exercise. The visual below shows how both activity types associate with outcomes across all five dimensions.
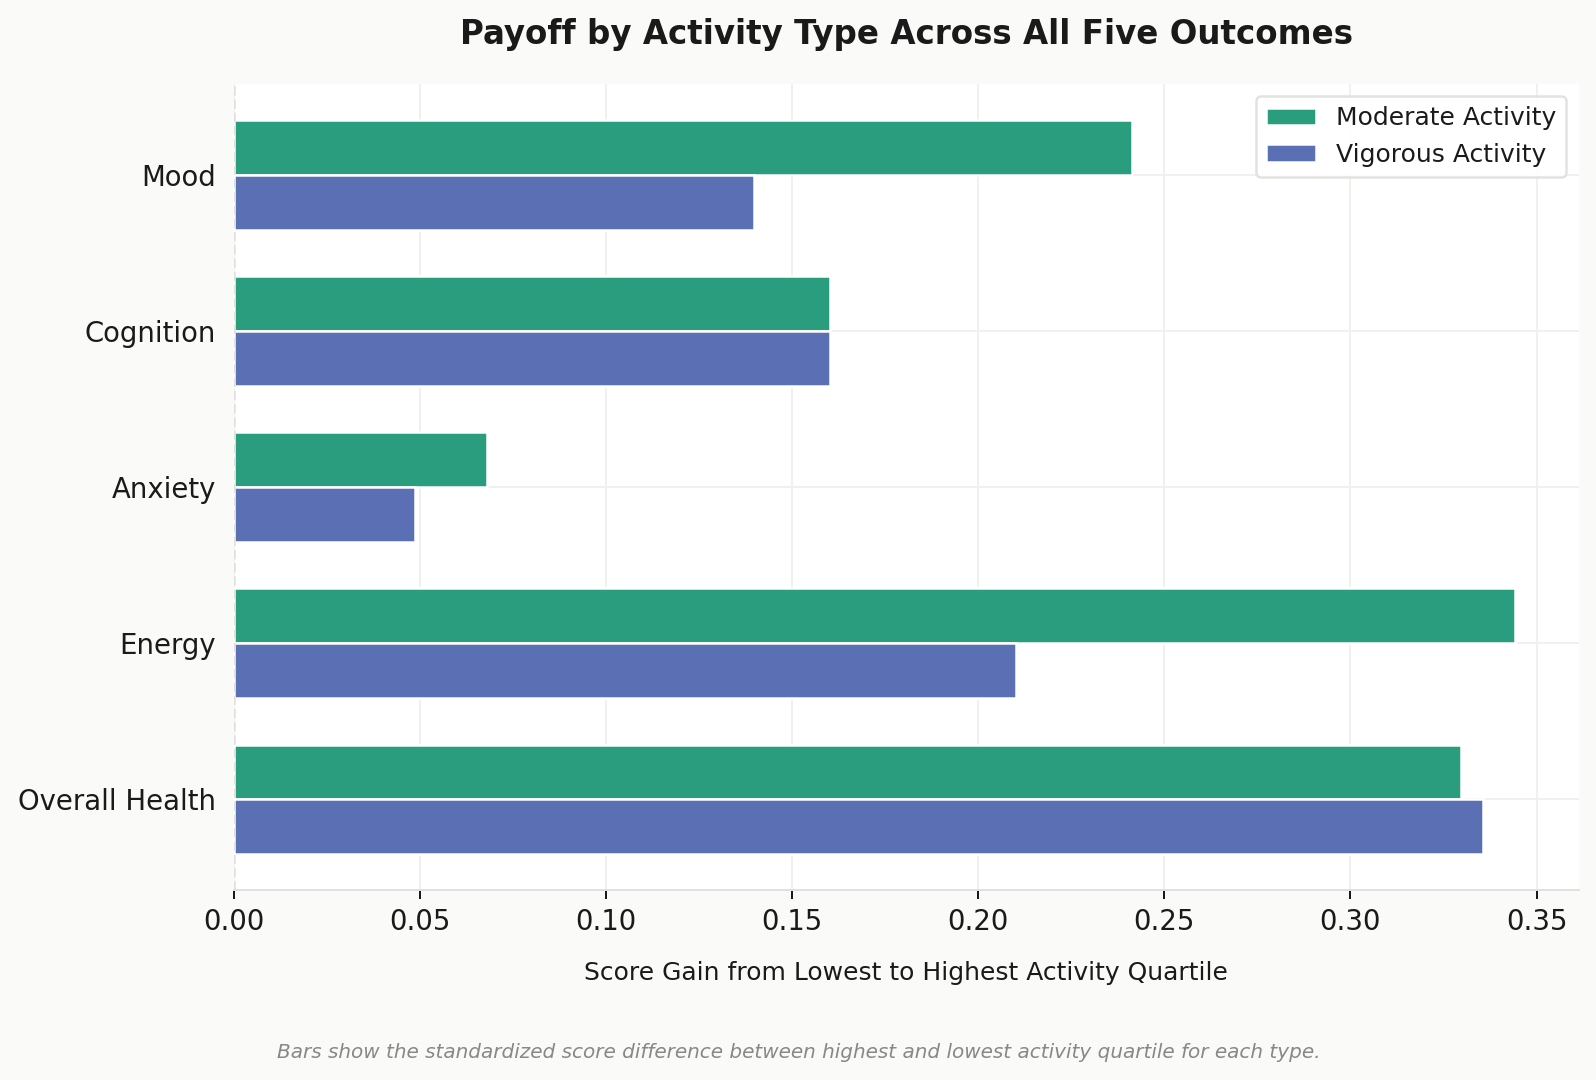
More movement, better outcomes. The relationship holds across all five dimensions and the gap between the most and least active groups is one of the more consistent findings across the entire dataset. The person getting regular activity in is pulling away from the person who is not, and the data shows it across energy, mood, cognition, and beyond.
What is more interesting is what happens when you separate the two activity types. Moderate activity held its own against vigorous across mental health outcomes and in some cases edged ahead. For mood and energy in particular, a long walk appears to do at least as much as a hard run or lift.
Sleep
NHANES captured sleep data across several dimensions: average hours, weekday and weekend hours separately, bedtime and wake time for both, and a derived measure of social jetlag. That last variable reflects the shift people make between their weekday and weekend schedules, the kind of internal clock disruption that tends to fly under the radar but has a real effect over time.
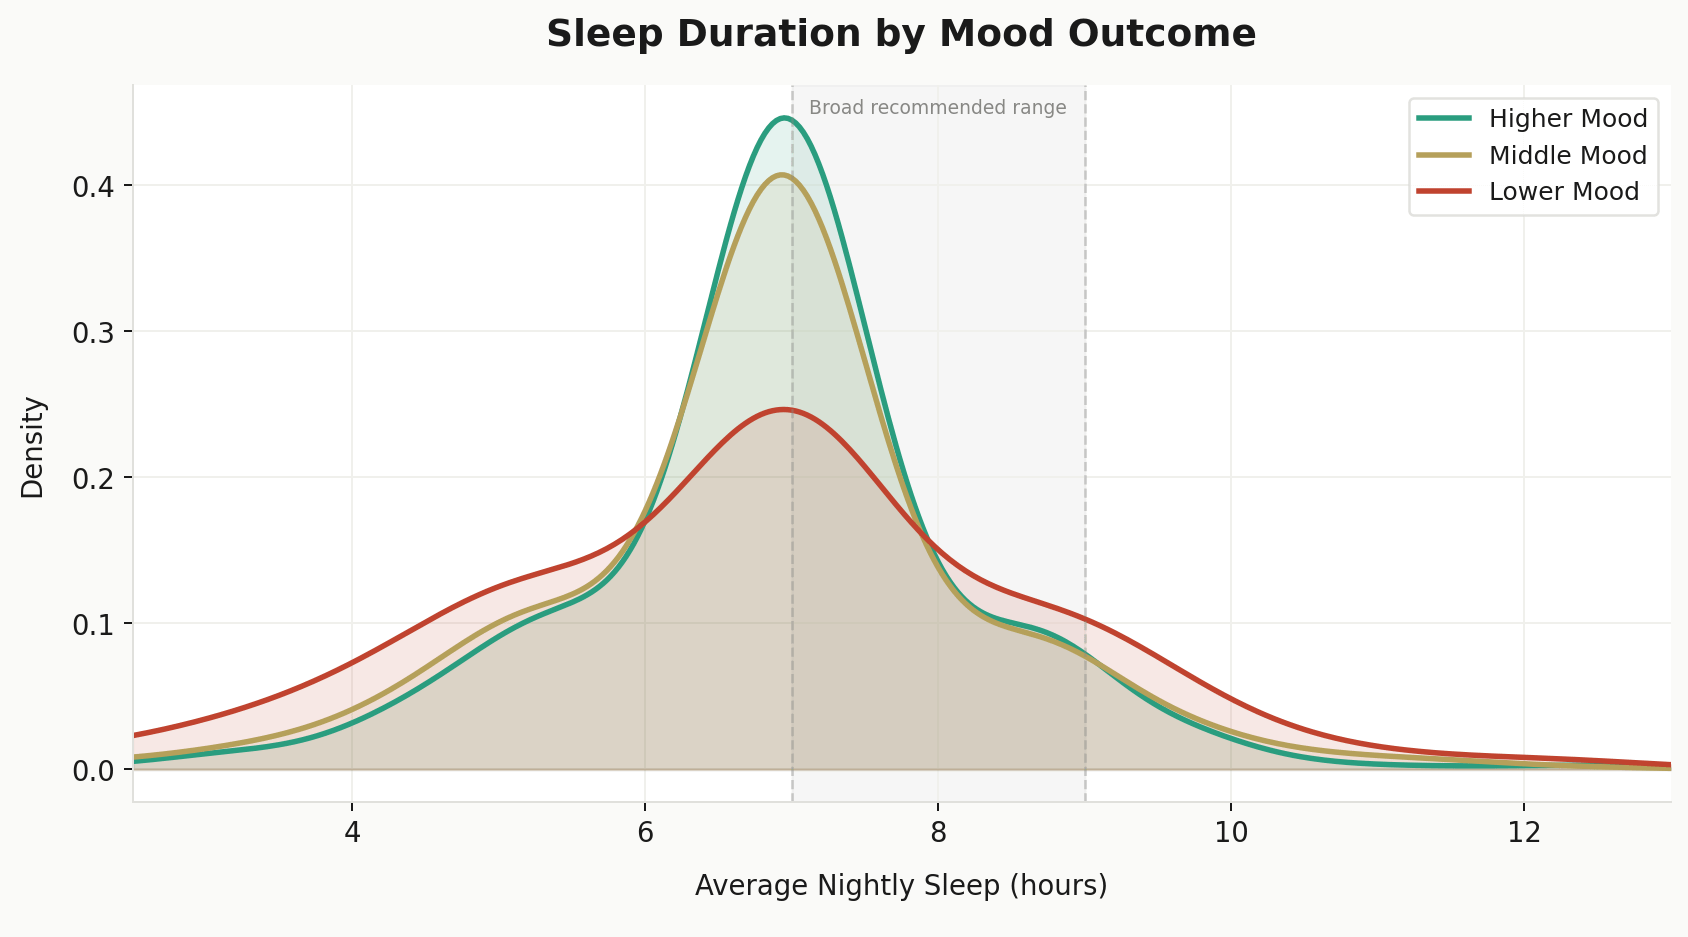
Sleep duration shows one of the cleaner patterns. Higher mood scorers cluster tightly around seven hours while lower mood scorers spread further into both tails, undersleeping and oversleeping at higher rates. The middle tertile sits in between, but the separation at the extremes is where the real story lives.
What is more surprising than hours alone is that timing appears to be just as impactful. Weekday bedtime and weekend wake time both showed meaningful associations with anxiety and mood outcomes, independent of total duration. Someone sleeping seven hours on a shifted schedule looks different in the data than someone sleeping seven hours on a consistent one.
Duration gets most of the attention. But what the data suggests is that when and how consistently someone sleeps may matter just as much.
Substance Use
Substance use was measured through alcohol, tobacco, and caffeine-related variables. Alcohol produced the clearest signal of all three. It was tracked across quantity, frequency, binge behavior, and a chronic use flag derived from sustained heavy consumption patterns. The visual below compares non-drinkers against chronic users across the four mental health outcomes the FPI is built to improve.
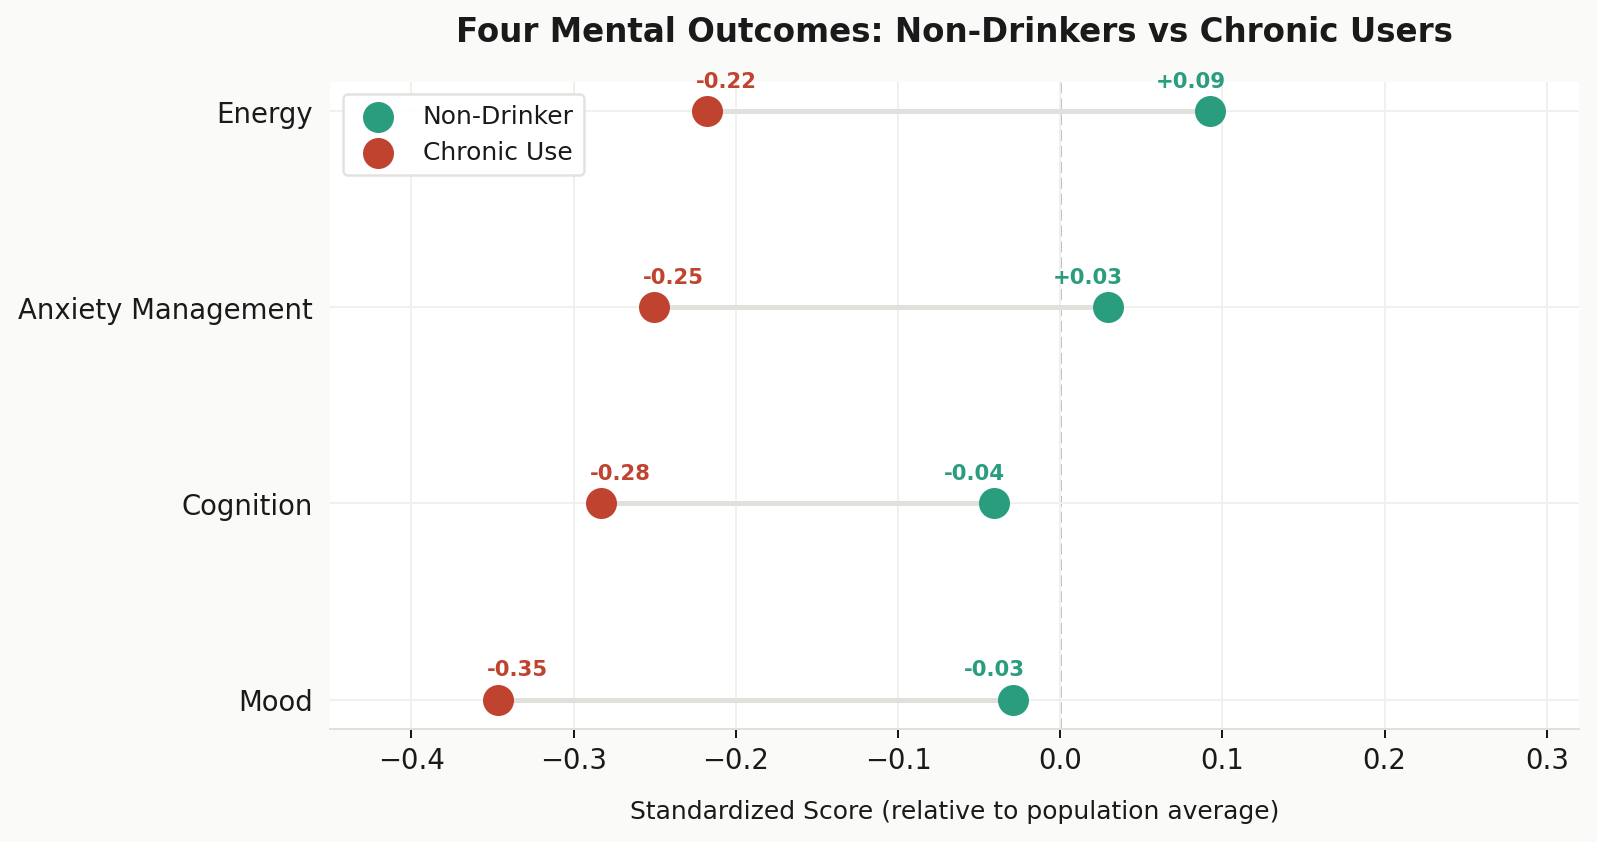
Across all four outcomes, chronic users score consistently and meaningfully below non-drinkers. If you find yourself running low on energy, struggling to focus or concentrate, or just feeling a little off mentally, it is worth asking whether drinking patterns are part of the picture.
Something worth noting is that cognition and mood show slightly negative scores for non-drinkers too, sitting just below the population average despite being the “healthy” group. That feels counterintuitive but reflects a well-documented pattern called the sick quitter effect, where people who abstain entirely are more likely to have stopped due to illness or medications than to have simply never had the habit.
Examples like this are precisely why the context layer exists. Before any behavioral signal gets evaluated, the model first accounts for age, medical history, and the broader circumstances someone is operating within. A non-drinker managing multiple chronic conditions is not the same baseline as a non-drinker in good health, and without that separation the data will be misleading.
From a Data Perspective
This post closes out Phase 2. Every domain across context, drivers, and outcomes has now been preprocessed and organized into the model-ready dataset. The real question preprocessing is meant to answer is not what data is available, but what data is actually worth using.
One step worth noting is the application of survey weights. NHANES is a complex survey designed to represent the broader U.S. population rather than a simple random sample, and the final dataset carries four survey design variables as pipeline infrastructure. Without them the model would be drawing conclusions from a sample rather than the population it is meant to represent.
From here the series moves into modeling and production across the next several updates:
Update #9: Pruning, where the variable set gets trimmed to what the data can actually support.
Update #10: Stratification, where comparison groups get formally defined before any behavioral signal is evaluated.
Update #11: App design and layout, where the model output starts becoming something a person can actually use.
The preprocessing phase has been slower than a typical series update cadence, and intentionally so for two reasons. The first is that a system designed to operate at this level of complexity requires genuine depth in each domain before any of it gets modeled. It is better to understand each domain before the model runs than to untangle bad assumptions after it does.
The second is that documenting each domain publicly while actively building it forced a level of clarity that pure development work rarely demands. When you have to explain why a variable belongs in the model or why one was excluded, you either know the answer or you find out quickly that you don’t. That discipline carried into the modeling work and made the decisions that followed cleaner and more defensible.
The pace picks up from here and the next few updates will reflect it. Grateful as always for the support along the way.